Hart field site

Sentinel 1 has completed its second trial at the Hart field site, targeting high priority pests and pathogens for the […]

Sentinel 1 has completed its second trial at the Hart field site, targeting high priority pests and pathogens for the grains industry.

Insect pests targeted

Green peach aphid (Myzus persicae)

Green mirid (Creontiades dilutus)

Western flower thrips (Frankliniella occidentalis)

Melon cotton aphid (Aphis gossypii)

Russian wheat aphid (Diuraphis noxia)

Oat aphid (Rhopalosiphum padi)

Corn aphid (Rhopalosiphum maidis)

Rose-grain aphid (Metopolophium dirhodum)

Green vegetable bug (Nezara viridula)

Onion thrips (Thrips tabaci)

Light brown apple moth (Epiphyas postvittana)

Fungal pathogens targeted

Ascochyta blight of peas (Didymella pinodes/Phoma pinodella)

Ascochyta blight of lentils (Ascochyta lentis)

Net form of net blotch of barley (Pyrenophora teres f. teres)

Spot type net blotch of barley (Pyrenophora teres f. maculata)

Blackleg of canola (Leptosphaeria maculans)

Septoria tritici blotch (STB) (Zymoseptoria tritici)

Chocolate spot of fava bean (Botrytis fabae)

Botrytis grey mould (Botryitis cinerea)

White grain disorder (E. tritici-australis)

White grain disorder (E. darliae/ pseudodarliae)

Sclerotinia white rot (Sclerotinia minor &/ S. sclerotiorum)

iMapPESTS data dashboard by Data Effects

Weather and data for pest and pathogens trapped by the suction traps are shared via the data dashboard (link below). Lure-trap target counts are updated weekly and shared on this page.

Weather data is captured and presented in real-time (temperature, relative humidity & rainfall).

Insect data are presented as the total number of each target insect counted in collected samples from our 2m or 6m traps as data becomes available.

Spore data is presented as kilo copies of target DNA per sample from spore samplers A & B as data becomes available.

Spore data is presented as kilo copies of target DNA per sample from spore samplers A & B as data becomes available.

Click here to view data dashboard for Hart 2020

*Dashboard best viewed on a desktop. Best viewed in landscape on a mobile phone/tablet

Sentinel surveillance trial summary for insects at Hart field site, 2020

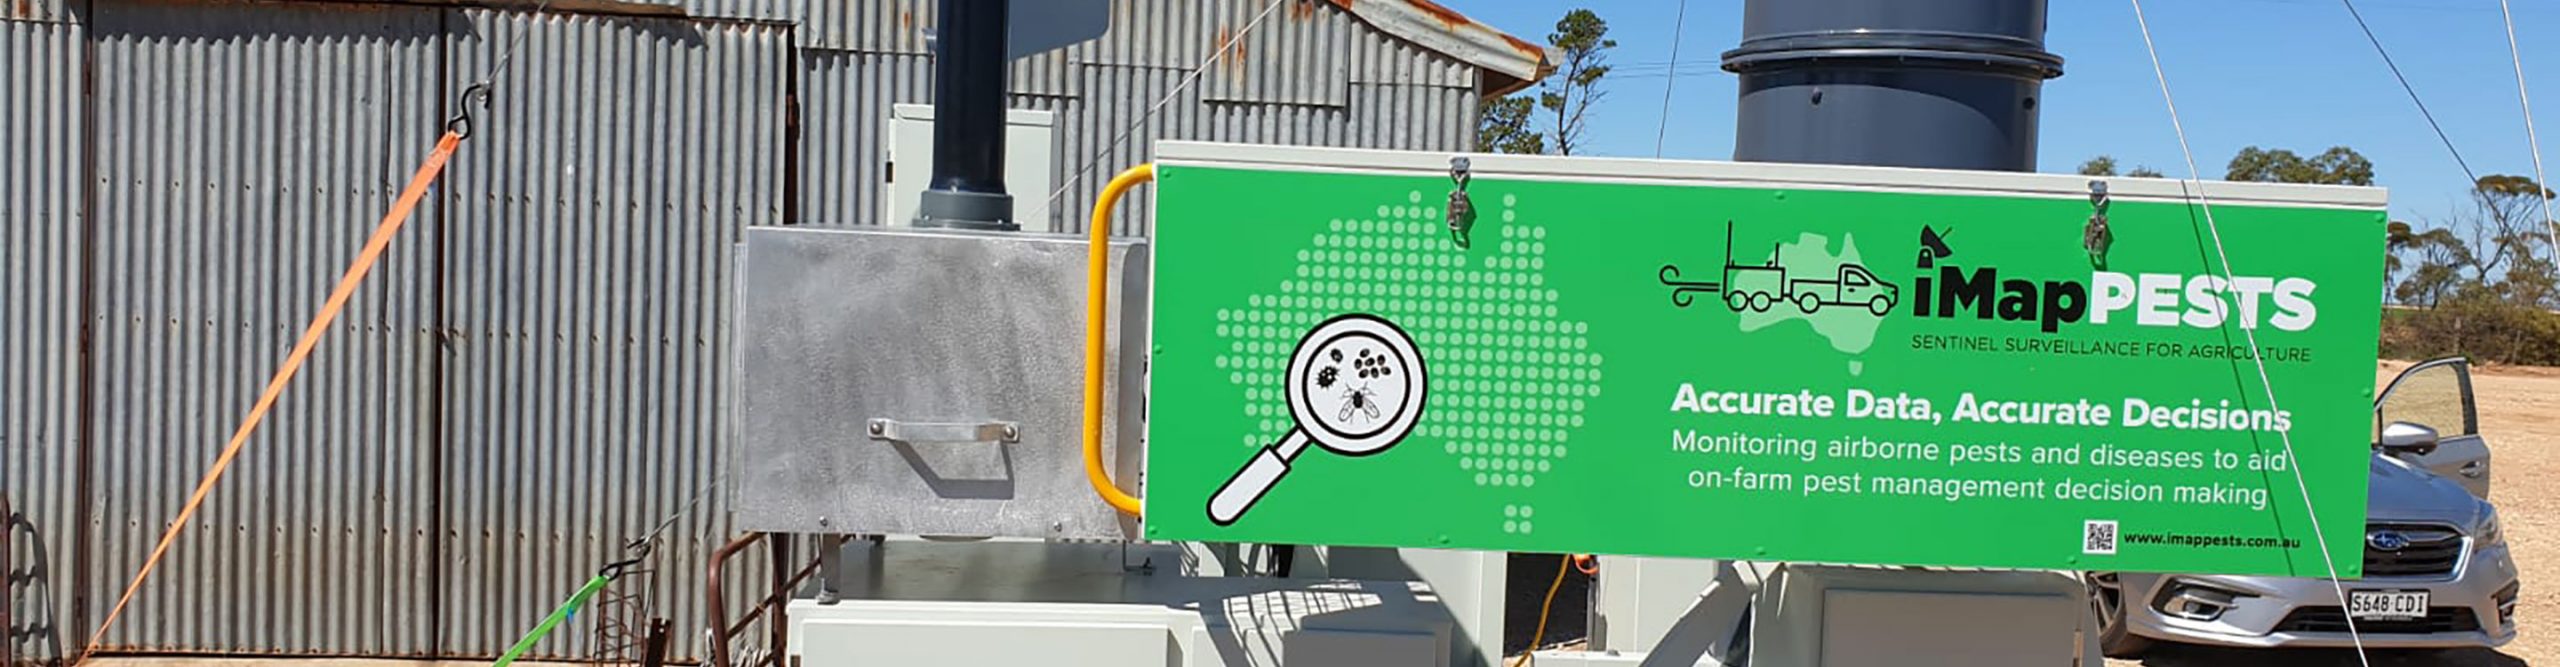
The iMapPESTS mobile surveillance prototype, Sentinel 1, completed its second trial at SA’s premier agronomic cropping site, Hart field site, from the 4th of August to the 2nd of November.

Sentinel 1 features one six-metre insect trap, a two-metre insect suction trap and two spore suction traps, as well as an onboard weather station. This site also collects data for targets captured by lure-based traps. Priority pests and pathogens for grains are targeted for identification at this site.

An overview of grains insect pests observed during the trial is presented here by SARDI entomologist, Helen Brodie, Hart field site research & extension manager, Bek Allen and AUSVEG engagement & adoption coordinator for iMapPESTS, Shakira Johnson.

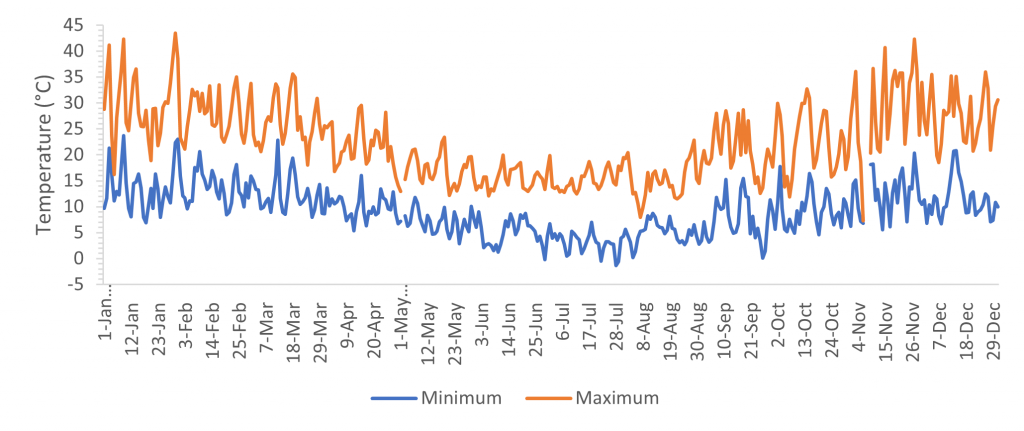
Seasonal conditions at Hart Field Site 2020

The Spring 2020 insect sampling at Hart demonstrated typical insect prevalence during a time when host plants are drying off and many insects are taking flight to seek “greener pastures”. Weather conditions greatly influence how many insects are in the air. The growing season at Hart in 2020 was defined by a dry winter, with relatively warm daily temperatures. These warm and sunny weather conditions, with gentle breezes, almost always result in higher insect captures.
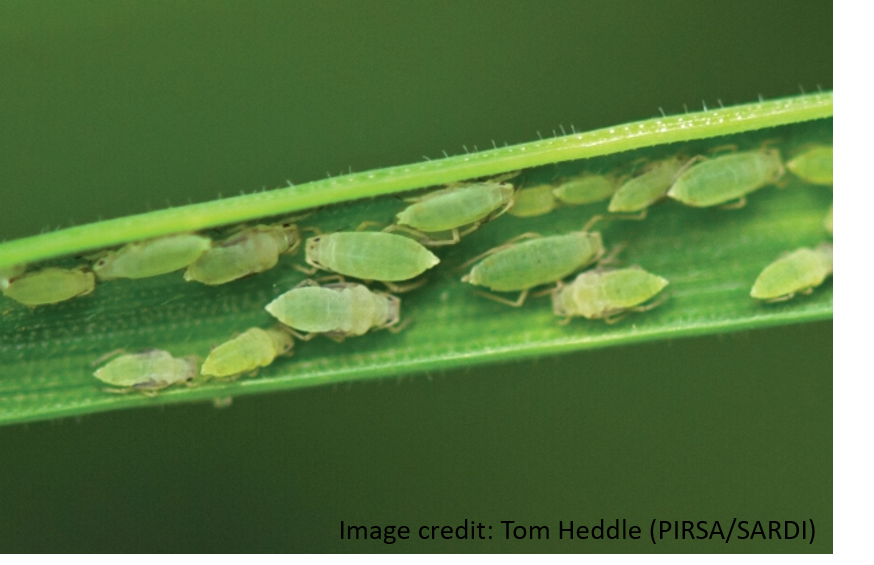
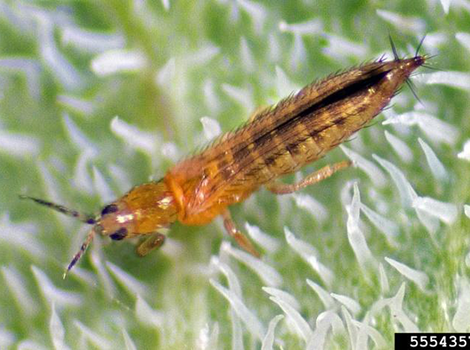
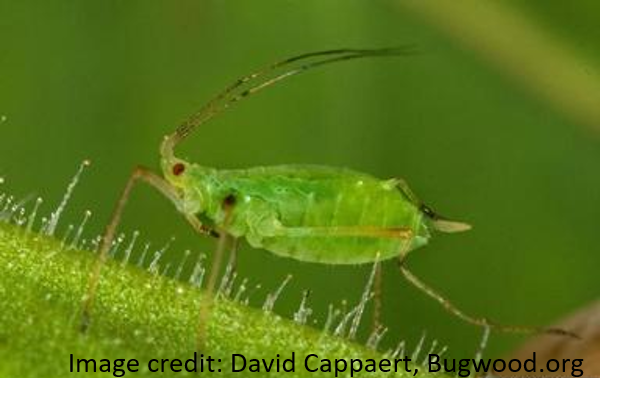
Maximum and minimum temperatures at Hart Field Site for 2020

Russian wheat aphid

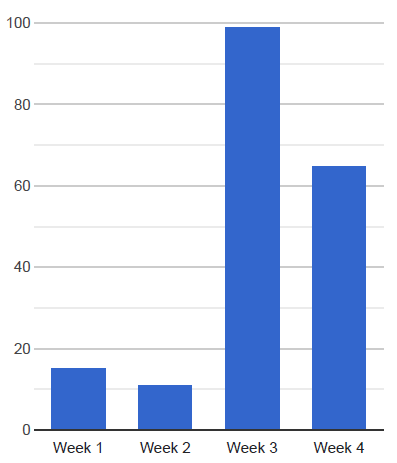
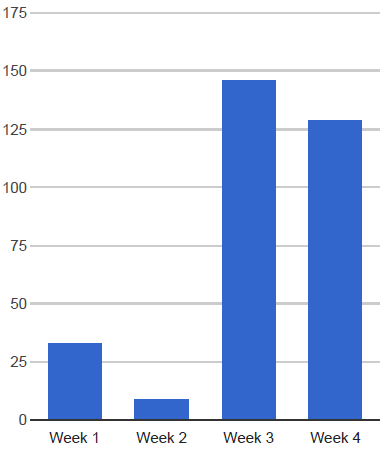
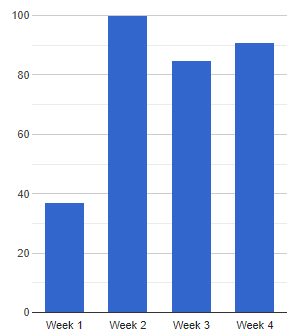
Russian wheat aphids (RWA) peaked in mid-October at 1173 aphids trapped and since these aphids tend to linger even on cereal plants that seem almost dead, this most likely represents the aphids abandoning roadside barley grass weeds that have died off earlier than crop cereals. Generally, the late-season peak of Russian wheat aphids on the wing occurs in November or even December depending on how quickly conditions dry up.

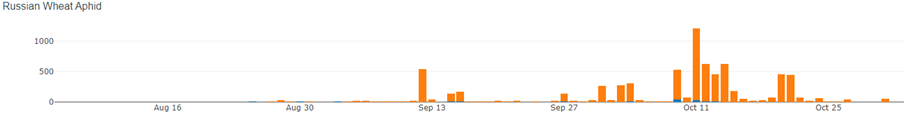
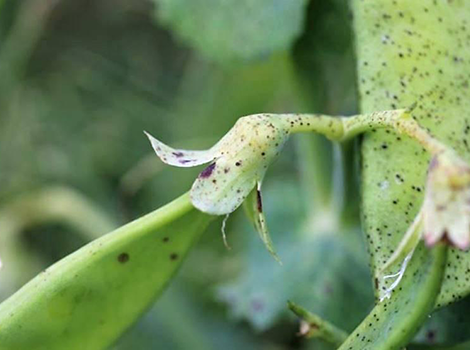
Low numbers of RWA were spotted at Hart on the 20th of August and were sprayed approximately one week later on the 26th of August. At this time, common visual crop damage consisting of purple streaking and leaf rolling was observed across most wheat crops. Damage was minimal.

In general, pest numbers are monitored on-site and insecticides are applied early when low-moderate numbers are present.
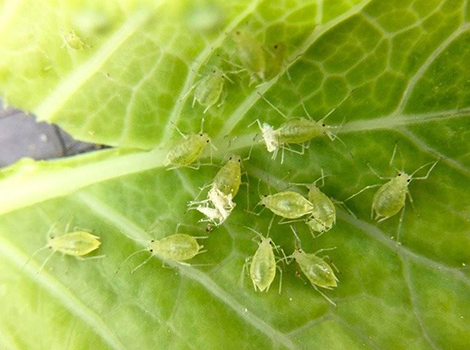
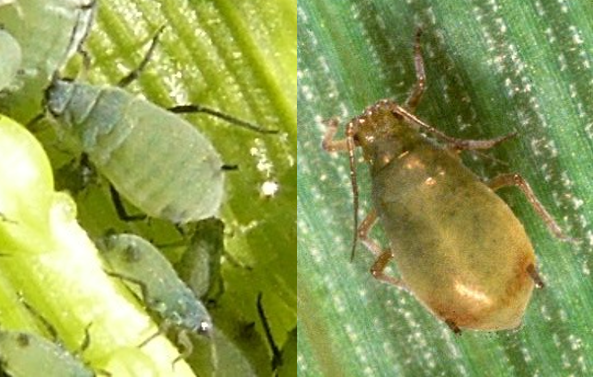
Green peach aphid

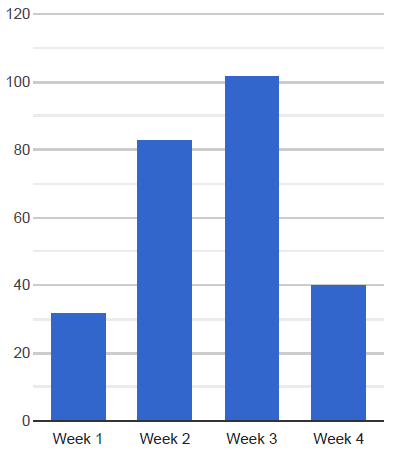
Green peach aphids peaked around mid-September coinciding with the time when their preferred canola leafy foliage would be drying, falling off the canola stalks and the plants focussed on ripening their seed pods. These aphids are quick to vacate a senescing or overcrowded host plant and take to the wing for new hosts. Coming into summer, suitable hosts in the area are limited, and aphids will be relying on roadside weeds, home gardens and irrigated crops.

Green peach aphid daily counts from two- and six- metre insect traps at Hart Field Site, 2020

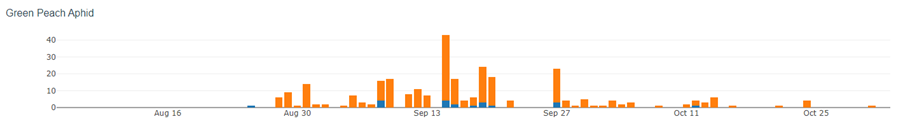
These observations also coincided with applications of insecticides to all pulse crops at Hart during podding on the 29th September.  Pulse crops are heavily monitored during this time for all pests including aphids and heliothis larvae. Pending pest pressure, pulses can be sprayed with insecticides every 2-3 weeks, from the start of flowering through to pod development.

Oat and corn aphids

Oat and corn aphids on the wing were in low and staggered numbers across the monitoring period but generally reduced after September. Their appearance in samples strongly reflected the weather conditions of each day. These aphids need fresh plants to maintain colonies and therefore will abandon senescing plants earlier than Russian wheat aphid.

Rose grain aphid is a minor player in this grain growing area and this was reflected by low numbers throughout and no significant peak period.

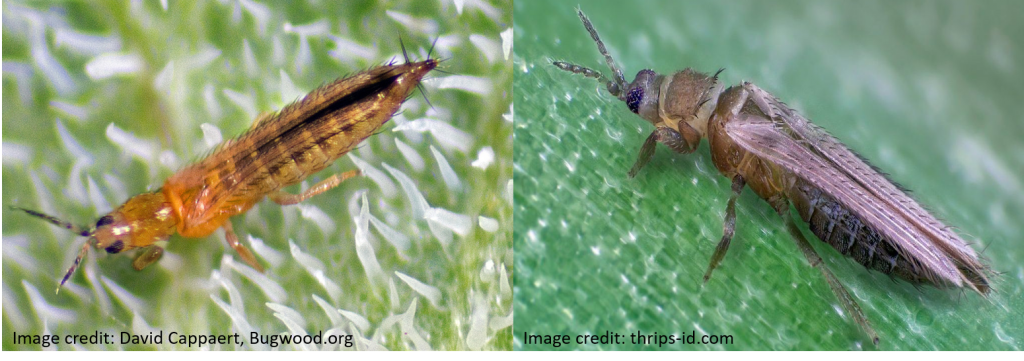
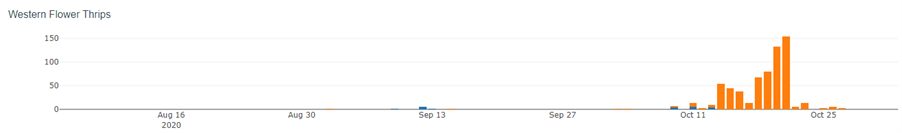
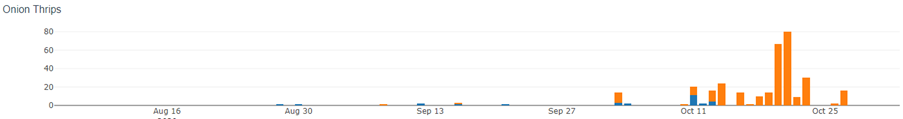
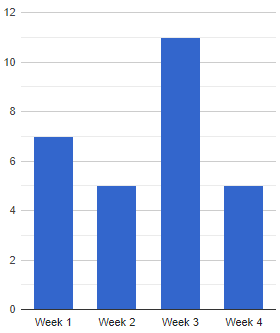
Western flower thrips and Onion thrips

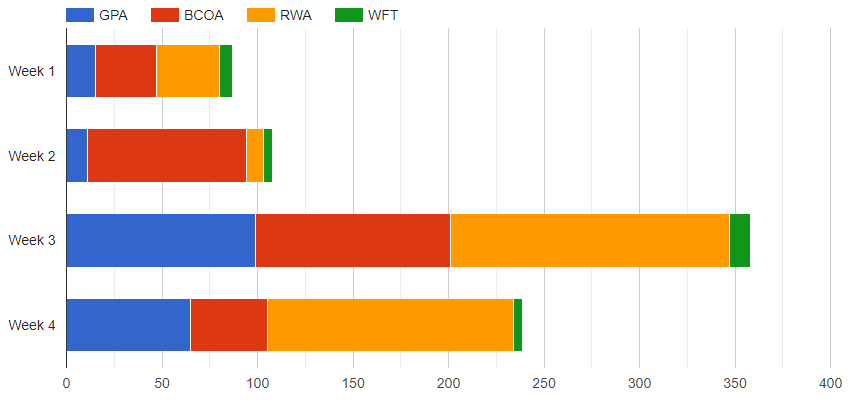
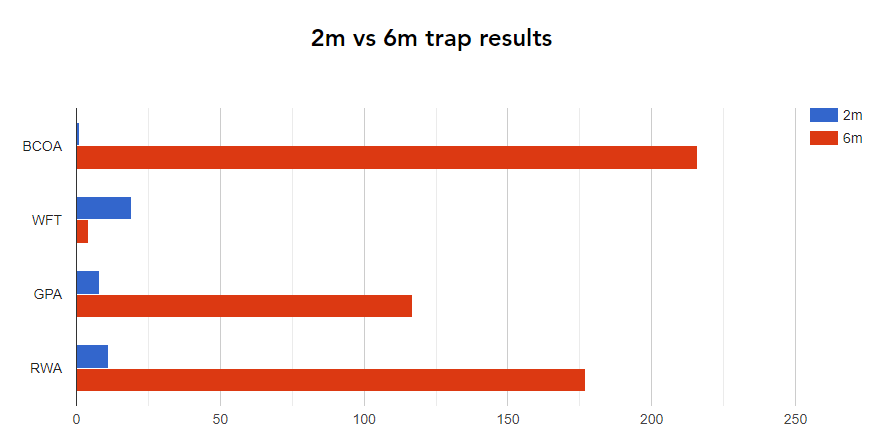
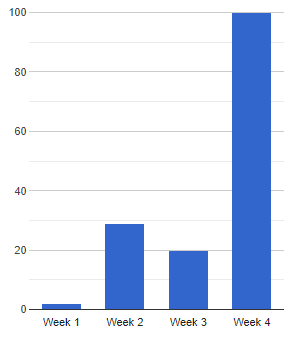
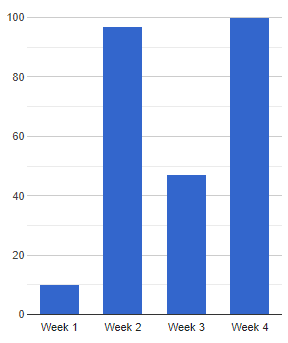
Western flower thrips (WFT) and onion thrips (OT) made an appearance in the third week of October, with a peak of 154 WFT and 80 OT, but settled down to minimal detection with the period of cooler wetter weather in the following weeks. The six-metre insect suction trap (orange bars) collected thrips at a much higher rate than the two-metre insect suction trap (blue bars).

The two-metre suction trap will generally provide information about the insects in the immediate paddock or property, whereas the taller six-metre suction trap will mostly represent what is happening at a larger (potentially regional) scale. Insects captured from six-metre height are mostly those that have been caught up in wind currents (small insects) or are flying a migratory pattern (larger insects). Given that insect pests are well managed at the Hart site, it is not surprising that the taller trap collects higher numbers as well as a greater diversity of insects. Additionally, the two insect traps use slightly different methods of suction which may impact the number and type of insects captured. Both these thrips species are hosted by canola crops and related roadside weeds such as turnip weed. With much canola being windrowed or browned off around that time, these thrips would be seeking fresh food and breeding sites.

Western flower thrips daily counts from two- and six- metre insect traps at Hart Field Site, 2020
Onion thrips daily counts from two- and six- metre insect traps at Hart Field Site, 2020

Pest moth lure-based trap surveillance of Native budworm at Hart field site

A lure-based trap targeting native budworm is set up in close proximity to the sentinel. Most recent native budworms counts are presented below.

Most recent lure trap observations 2/11/2020

Hart field site trial 2019

Each target monitored by iMapPESTS for the Hart field site are presented in graphs separately for each week. These targets were identified as priority pests & diseases by the grains industry.


Surveillance period
25/09/19 – 23/10/19

Insect data is presented as the total number of each target insect counted in collected samples for each week.

Spore data is normalised to 100% of the maximum counts detected of each target pathogen for each week.

Aphids

Green peach aphid (GPA) –
Myzus persicae


Oat aphid (OA) –
Rhopalosiphum padi


Russian wheat aphid (RWA) –
Diuraphis noxia


Aphids (green peach, Russian wheat and oat aphid) – A general trend of increasing winged aphid numbers is seen in response to the maturation and dying off of host plants (e.g. canola and cereals) forcing aphids to take wing in search of new green hosts. The decrease in aphid numbers in week 4 may suggest that most winged aphids have already found their new host or have died trying. The amount of green bridge available in the area will partially determine how well aphids survive over summer to reinfect crops in the new season.

Western flower thrips (WFT) – Frankinella occidentalis

Western flower thrips (WFT) – These introduced thrips are now ubiquitous in many Australian landscapes due to their wide host range. Whilst rarely an issue in the grains industry, they survive on some crops and build up populations that can impact on vegetable horticulture by the transmission of virus such as Tomato spotted wilt virus. As with aphids, warm weather and decreasing quality of host plants will prompt them to take to the air and be moved about in wind currents. In all the samples, the dominant thrips species was Thrips imaginis (Plague thrips) which may look similar to WFT but is far less damaging.

Composition of traps

2m vs 6m trap results

More aphids were collected in the 6m trap than the 2m trap. The shorter suction trap will generally provide information about the insects in the immediate paddock or property, whereas the taller 6m trap will mostly represent what is happening at a larger (potentially regional) scale. Insects captured from 6m height are mostly those that have been caught up in wind currents (small insects) or are flying a migratory pattern (larger insects). Given that insect pests are well managed at the Hart site, it is not surprising that the taller trap collects higher numbers as well as a greater diversity of insects. Additionally, the two insect traps use slightly different methods of suction which may impact on the number and type of insects captured.

Black leg of canola
(Leptosphaeria maculans)

Spore release increased steadily over the 4 week period. This is likely driven by a rain event (10 mm) prior to week 1 & small rain event (2mm) at the end of week 2 causing subsequent spore maturation and liberation.

Botrytis grey mould
(Botrytis cinerea)

Maximum spore release was observed in Week 2 & 4. Spore release is typically driven by high humidity within crop canopy and wind events for dispersal.

Blackspot of field peas
(Didymella pinodes)

Spore release increased steadily over the 4 week period. This is likely driven by a rain event (10 mm) prior to week 1 & small rain event (2mm) at the end of week 2 causing subsequent spore maturation and liberation.

Septoria
(Zymoseptoria tritici)

Maximum spore release was observed in week 2 & 4. Spore release is typically driven by leaf wetness periods, particularly from leaf debris on the soil surface.